
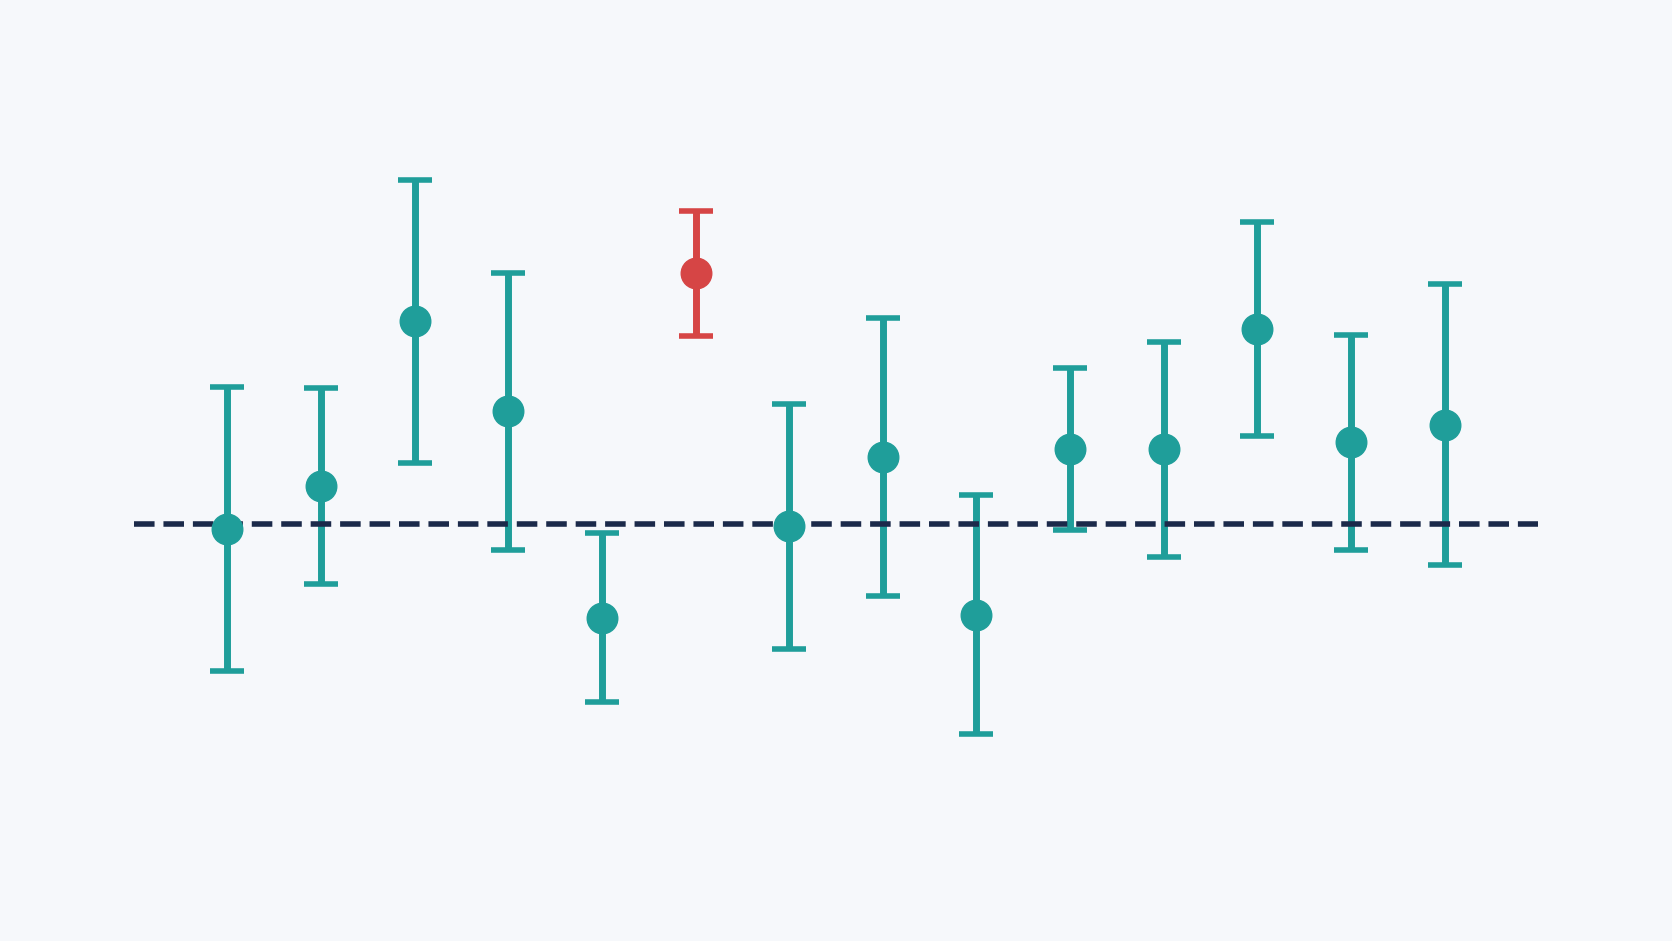
Common statistical errors in medical research shape what doctors read and what patients receive. A wrong test, an underpowered study or a quietly dropped group of participants can make a weak signal look like a finding. The American Statistical Association found the problem serious enough to publish a formal statement on p-values in 2016 [1]. This guide lists ten statistical mistakes that appear again and again. Then it turns to three published studies that measured how often they occur. Use them to check your own analyses before submission.
What Are the Most Common Statistical Errors in Medical Research?
Most mistakes in medical studies fall into a short list of repeat offenders. The table sums up ten of them with the fix that usually works.
| Mistake | What goes wrong | Usual fix |
|---|---|---|
| Misreading the p-value | It is read as the probability that the hypothesis is true | Report the effect size and a confidence interval next to it |
| Treating 0.05 as a cliff | A result at 0.049 is called real and one at 0.051 is called nothing | Judge the size and precision of the effect |
| Skipping multiple comparison correction | Every extra test adds to the type I error rate | Prespecify the tests, then apply Bonferroni or a false discovery rate method |
| Too small a sample size | Real effects are missed (type II error), and significant ones are overstated | Calculate the sample size before data collection |
| Using a t-test on skewed data | The normality assumption does not hold | Check the distribution first and use nonparametric tests if needed |
| Running many t-tests instead of ANOVA | Pairwise tests multiply the false positives, because ANOVA compares variance across groups in one step | Use ANOVA, then adjusted post hoc comparisons |
| Ignoring missing data | Dropping incomplete cases can bias the result | Plan for it, use multiple imputation and run a sensitivity analysis |
| Reading correlation as causation | A predictor is linked to an outcome by a third factor | Match the claim to the study design and adjust for confounders |
| Overfitting regression models | Too many predictors for too few events, so the regression coefficients look better than they are | Limit the number of predictors and validate on new data |
| Reporting errors | The p-value in the text does not match the test statistic | Recompute the values and keep unrounded numbers until the end |
Why These Statistical Mistakes Keep Happening
None of these statistical tests is exotic, and none of the mistakes is rare. Instead, most come from habits that nobody questions. Therefore, researchers who work alone are more likely to repeat them, and a statistician reviewing the analyses early catches many of them. The three studies below show how this looks in practice.
Why Common Statistical Errors in Medical Research Reach Patients
Common statistical errors in medical research matter because published results feed into guidelines, drug approvals and everyday clinical decisions, so physiological findings in a small study can turn into practice. For instance, a false positive from a weak analysis can send other teams down the wrong path for years. Likewise, a missed effect can shelve a treatment that works. Peer review catches some of these problems, but as the next section shows, it does not catch all of them. Also, pressure to publish significant results makes selective reporting tempting. Still, a written plan before the first patient is enrolled removes most of that temptation. Our article on how to build a statistical analysis plan for clinical trials shows what such a plan contains.
Hypothesis Testing and p-Values: Incongruent Results in Nature and BMJ
Emili García-Berthou and Carles Alcaraz [2] asked a simple question: do the reported p-values match the reported test statistics? Given a test statistic and its degrees of freedom, any statistical package can recompute the p-value. The authors checked all papers in volumes 409 to 412 of Nature. They also checked a random sample of 63 results from BMJ volumes 322 and 323. All came from 2001.
They found incongruent results in 11.6% of Nature results (21 of 181) and 11.1% of BMJ results (7 of 63) [2]. Also, at least one such error appeared in 38% of the Nature papers and 25% of the BMJ papers. In 12% of cases, the significance level might change by one or more orders of magnitude. Overall, the authors judge that most of the errors were probably due to rounding, transcription or typesetting. The last digits of the test statistics were also unevenly distributed. The authors read this as digit preference in rounding and reporting.
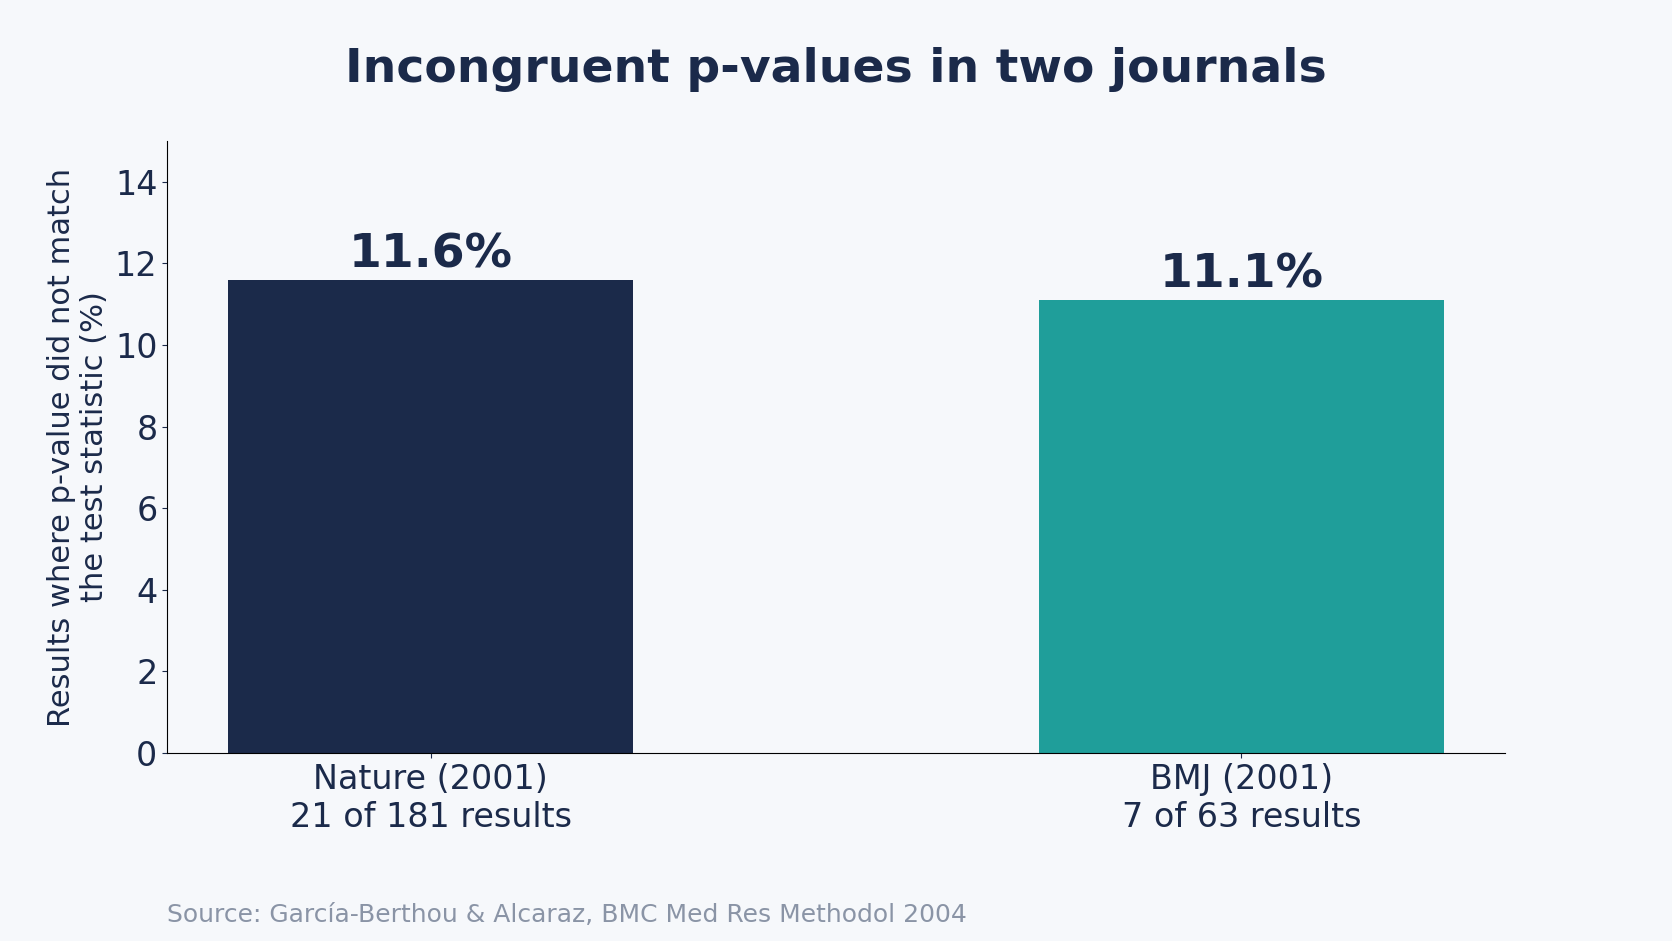
Recomputing a p-value takes seconds in any statistical package. So the fix is to do it yourself. Then keep full precision in the output and paste values straight from the software into the manuscript.
Sample Size and Power: What Neuroscience Meta-Analyses Revealed
Katherine Button and colleagues [3] pooled the analyses from neuroscience meta-analyses to estimate how much power typical studies had. They put the median statistical power between about 8% and 31%. Consequently, low power has two costs. First, a small study is less likely to detect a true effect. Second, a statistically significant result from a small study is also less likely to be a true effect. In addition, the authors add that low power leads to overestimated effects and poor reproducibility.
The paper covers neuroscience, but the logic applies to any field with small samples, including clinical research. As a result, the practical lesson is a power calculation at the design stage. Take the expected effect size from earlier work and avoid a hopeful guess.
Missing Data in Randomized Trials: A Review of Four Top Journals
Melanie Bell and colleagues [4] reviewed randomized trials from July to December 2013. The journals were BMJ, JAMA, The Lancet and the New England Journal of Medicine. Of the 77 eligible articles, 73 (95%) reported some missing outcome data. The median share of participants without an outcome was 9%, and the range ran from 0 to 70%.
The most common approach in the primary analysis was complete case analysis, used in 33 trials (45%) [4]. By contrast, multiple imputation appeared in only 6 (8%). Meanwhile, among trials with incomplete outcomes, 27 (35%) reported a sensitivity analysis. However, most of those did not change the assumptions about the missing values. The authors describe a large gap between statistical methods research on missing data and how trials apply it.
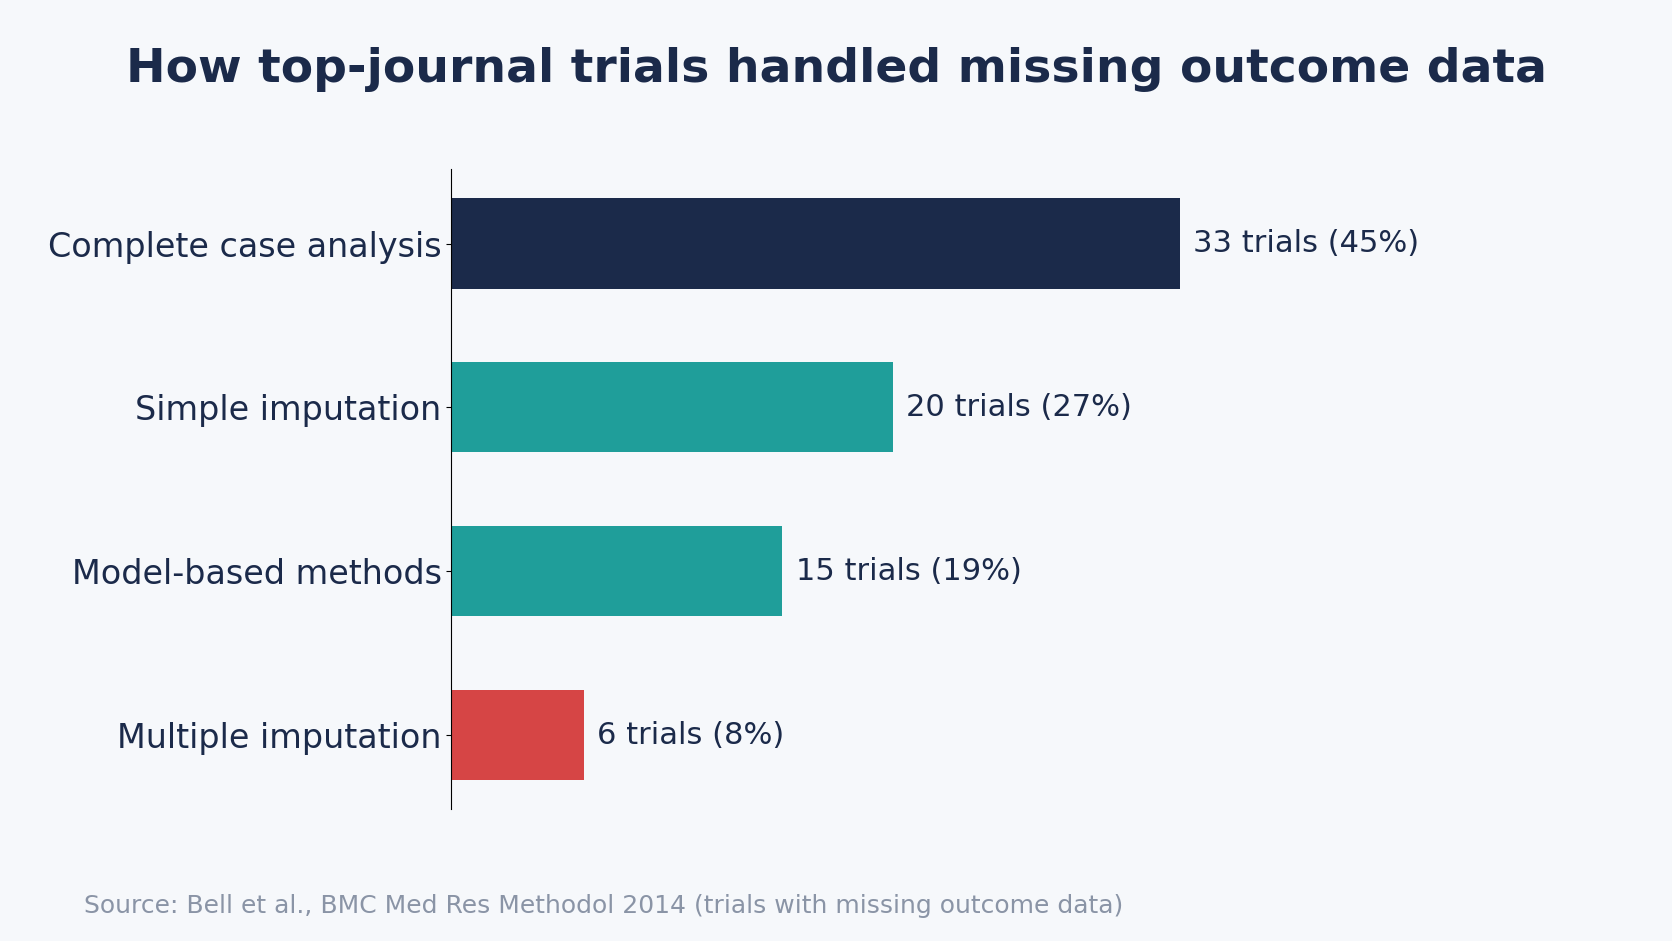
A trial with 9% missing outcomes can still give a valid answer. However, the analysis has to state its assumptions and test them. Write the plan for missing values into the protocol and report a sensitivity analysis in the paper.
The Future of Statistical Analysis in Medical Research
The ASA statement offers one answer to common statistical errors in medical research: estimation over testing. It names confidence intervals, Bayesian methods and false discovery rates as supplements to p-values [1]. Therefore, that shift needs statisticians involved from the study design stage. The same applies to AI work. Errors such as data leakage between training and test sets and poor calibration of clinical prediction models follow one pattern. A sound idea meets a small oversight in the analyses, and the result looks better than it is. Automated checks can already recompute reported statistics, which is the test García-Berthou and Alcaraz ran by hand [2].
Get a Second Opinion on Your Statistical Methods
Neural Board works with healthcare organizations on AI and data analysis in medicine. Does your team want a second look at a statistical method, an analysis plan or a model before it reaches a journal? Contact us and we will talk it through.
References
- Wasserstein, Ronald L., and Nicole A. Lazar. “The ASA Statement on p-Values: Context, Process, and Purpose.” The American Statistician, vol. 70, no. 2, 2016, pp. 129-133. https://doi.org/10.1080/00031305.2016.1154108
- García-Berthou, Emili, and Carles Alcaraz. “Incongruence between Test Statistics and P Values in Medical Papers.” BMC Medical Research Methodology, vol. 4, 2004, article 13. https://doi.org/10.1186/1471-2288-4-13
- Button, Katherine S., et al. “Power Failure: Why Small Sample Size Undermines the Reliability of Neuroscience.” Nature Reviews Neuroscience, vol. 14, no. 5, 2013, pp. 365-376. https://doi.org/10.1038/nrn3475
- Bell, Melanie L., et al. “Handling Missing Data in RCTs; a Review of the Top Medical Journals.” BMC Medical Research Methodology, vol. 14, 2014, article 118. https://doi.org/10.1186/1471-2288-14-118