
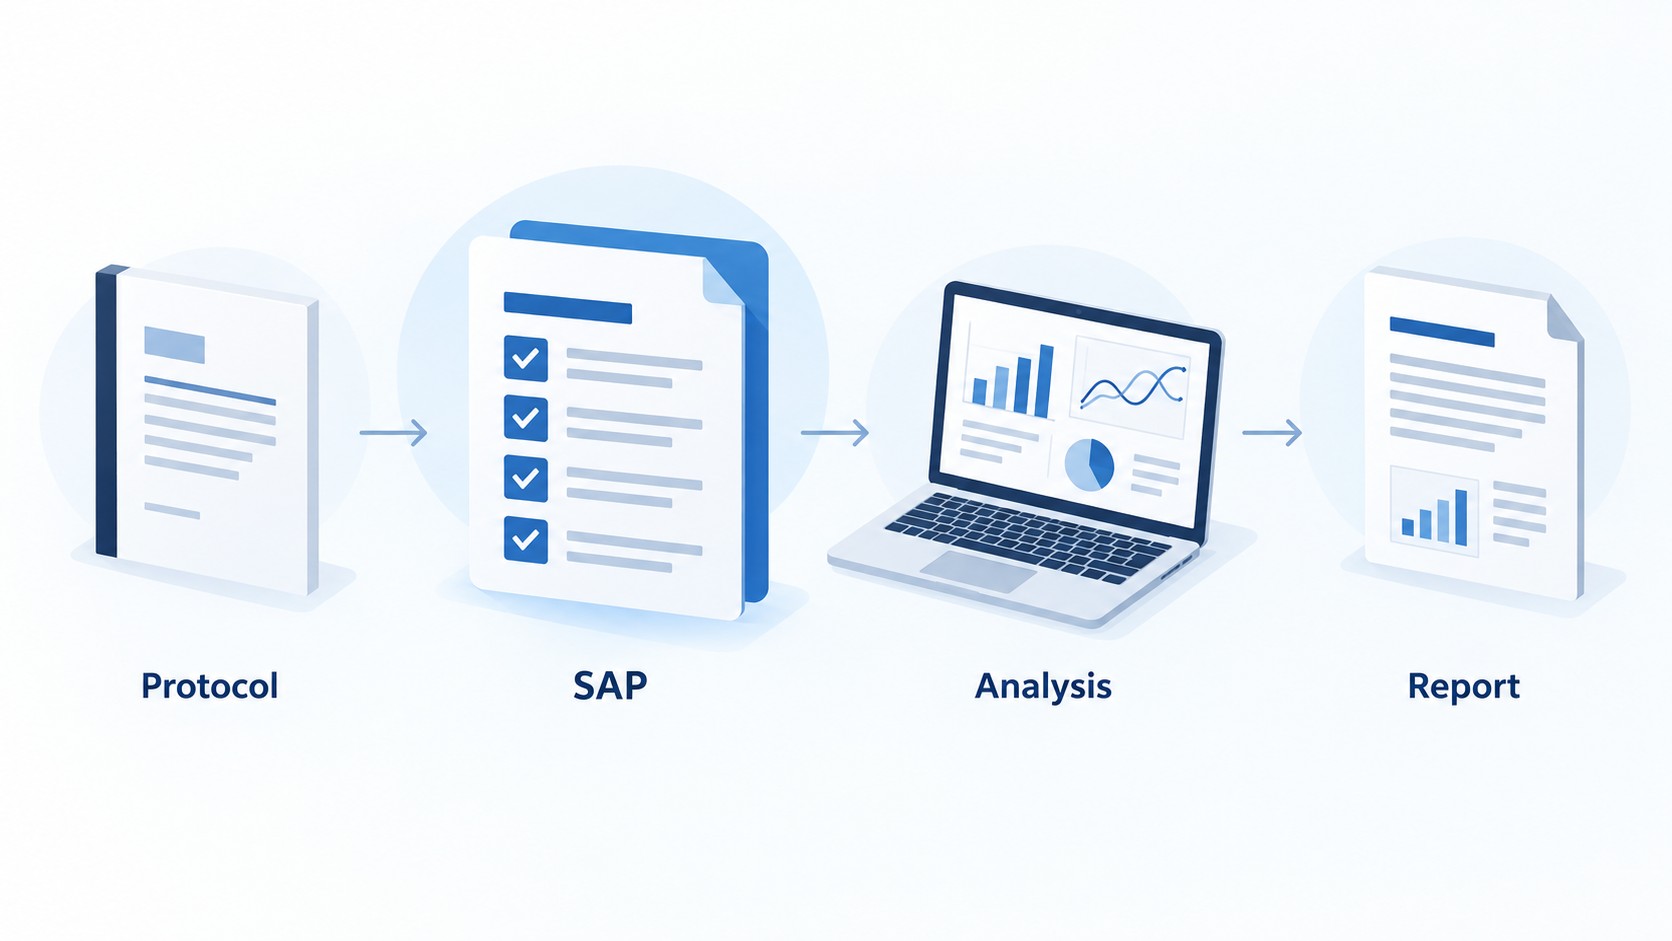
A statistical analysis plan for a clinical trial turns research questions into clear instructions before teams examine unblinded results. A reusable template organizes decisions and supports reproducible work. This guide covers essential content and three software examples. Observational studies need different provisions, particularly for confounding and other sources of bias.
What a Statistical Analysis Plan for a Clinical Trial Should Include
A reusable statistical analysis plan template gives the study team fields to complete, rather than methods to copy unquestioningly. Each choice must fit the research question and study design.
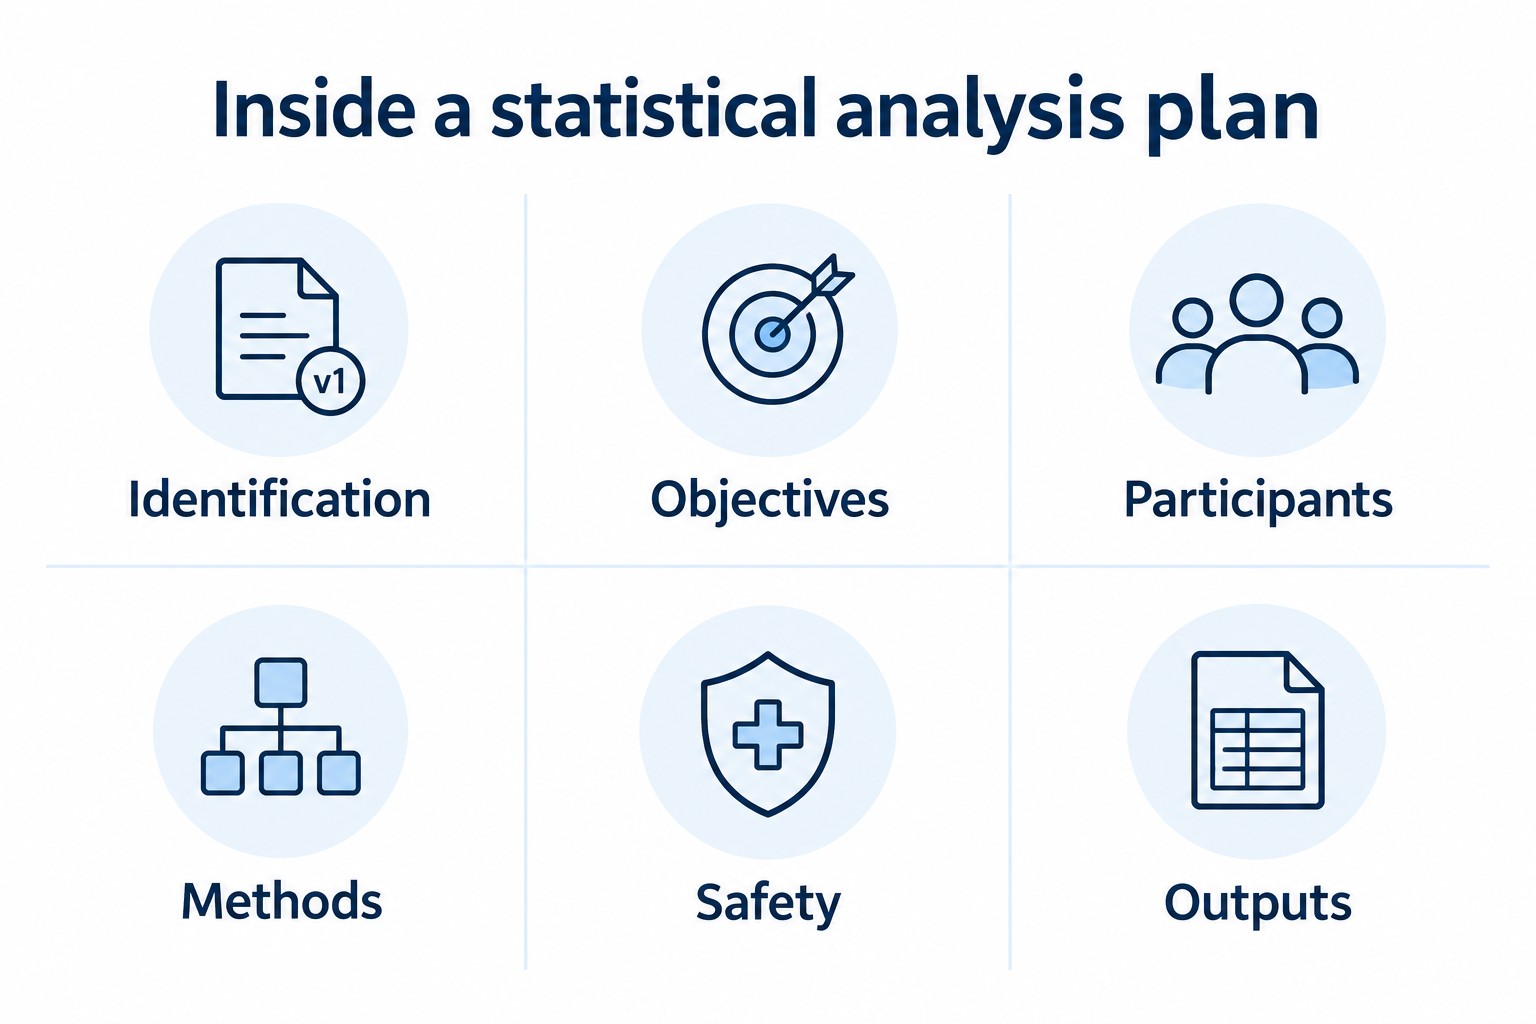
Gamble and colleagues’ guidance on the content of statistical analysis plans focuses on final analyses of later-phase randomized trials. Its checklist provides a starting point for these reusable fields [1]:
- Identification: trial registration, study protocol version, SAP version, authors, reviewers and approval dates.
- Objectives: study objectives, endpoints, assessment times and the treatment effect of interest.
- Participants: each analysis population, eligibility rules and treatment of protocol deviations.
- Methods: planned statistical methods, covariates, multiple comparisons, missing data and sensitivity analyses.
- Safety: adverse-event summaries, exposure measures and relevant laboratory assessments.
- Outputs: planned tables, figures and the timing of final statistical analyses.
Include sample size calculations or reference their location in the clinical trial protocol. Record responsibilities, amendment dates and reasons for changes. Decisions need a traceable history.
The statistical analysis section of a protocol needs detail in a separate statistical analysis plan. For interventional trials, adapt the fields to their objectives and endpoints. For observational research, add explicit confounding controls. A statistician should review the SAP to ensure that statistical methods match the intended comparisons.
Why a Clinical Trial Statistical Analysis Plan Matters
Prespecification limits favorable choices after results emerge: changed endpoints, selective comparisons or undocumented analyses. Primary, secondary and sensitivity analyses need clear roles; exploratory findings need labels. Planning cannot remove every bias. The following tools support independent design checks and reproducibility, while a statistician remains responsible for suitable methods and validation [2].
Compare Sample Size and Allocation Options with an R Shiny Trial-Design App
Grayling and Wason developed an R Shiny application for multi-arm clinical trial design. Their 2020 paper demonstrates how researchers can compare treatments against a shared control group [3].
The application calculates sample size under assumptions about treatment effects, outcome variability and allocation ratios. It supports multiple-comparison corrections and definitions of power. Consequently, researchers can compare design options before choosing their planned analysis approach.
The authors illustrate the application with assumptions motivated by a phase II oncology trial. They compare analytical calculations with simulations, including checks across 1,000 generated input combinations. Simulation agreement supports checking, but does not establish formal validation. The paper explicitly identifies lack of validation as a limitation.
For a statistical analysis plan in a clinical trial, preserve the reasoning behind the selected settings:
- Specify the assumed effects and outcome distribution.
- Record power, significance thresholds and allocation across arms.
- Identify the multiple-comparison correction and supporting calculations.
- Document independent checks, software versions and relevant code.
The SAP can reference calculations in the protocol instead of repeating them. However, researchers must still clearly explain which assumptions support the chosen statistical methods. This is a statistical software example. It does not demonstrate AI or prove that a treatment improves patient outcomes.
Plan Interim Analyses and Treatment-Arm Selection with the R MAMS Package
Jaki, Pallmann and Magirr describe MAMS, an R package for multi-arm, multi-stage studies [4]. Such designs can stop ineffective treatments early while continuing promising candidates against a shared control.
Their paper includes a step-down example that compares two selection rules: continue all promising treatments or retain only the best treatment. The rules produce different testing boundaries. Therefore, a statistical analysis plan for a clinical trial must specify selection rules before interpreting interim analyses.
The package supports simulations of a design’s operating characteristics. These checks help researchers examine false-positive probabilities, power and expected recruitment under assumptions. They do not guarantee performance when those assumptions fail.
Within the SAP, record:
- When interim analyses occur and which information triggers them.
- Efficacy and futility boundaries, with treatment-selection rules.
- Who can access unblinded results and make decisions.
- How statistical analyses control false-positive risk across comparisons and stages.
Unexpected changes need statistical safeguards. The paper describes conditional-error methods for certain unplanned modifications, including altered recruitment and treatment selection. A written justification alone cannot preserve error control.
Match this analysis approach to the trial design and available endpoints. A statistician must assess its assumptions, calculations and implementation. Record deviations from the SAP and distinguish amendments from original decisions. An independent biostatistical review can provide that check.
Turn Clinical Trial Analyses into Repeatable Reports with listdown and R Markdown
Kane, Jiang and Urbanek present listdown as a tool for reproducible clinical trial document generation [5]. Their workflow separates computational results from the instructions that organize and display them through R Markdown.
The paper demonstrates this approach with synthetic lung-cancer trial data. It combines patient characteristics, outcomes and adverse-event information, then creates structured analysis objects for reporting. These data illustrate software behavior; they provide no evidence of treatment effectiveness.
For a statistical analysis plan supporting a clinical trial, this separation connects planned outputs with repeatable reporting:
- Statistical programmers implement the approved analysis methods.
- Code creates tables, plots and result objects.
- listdown organizes those objects into a document hierarchy.
- R Markdown renders the report for review.
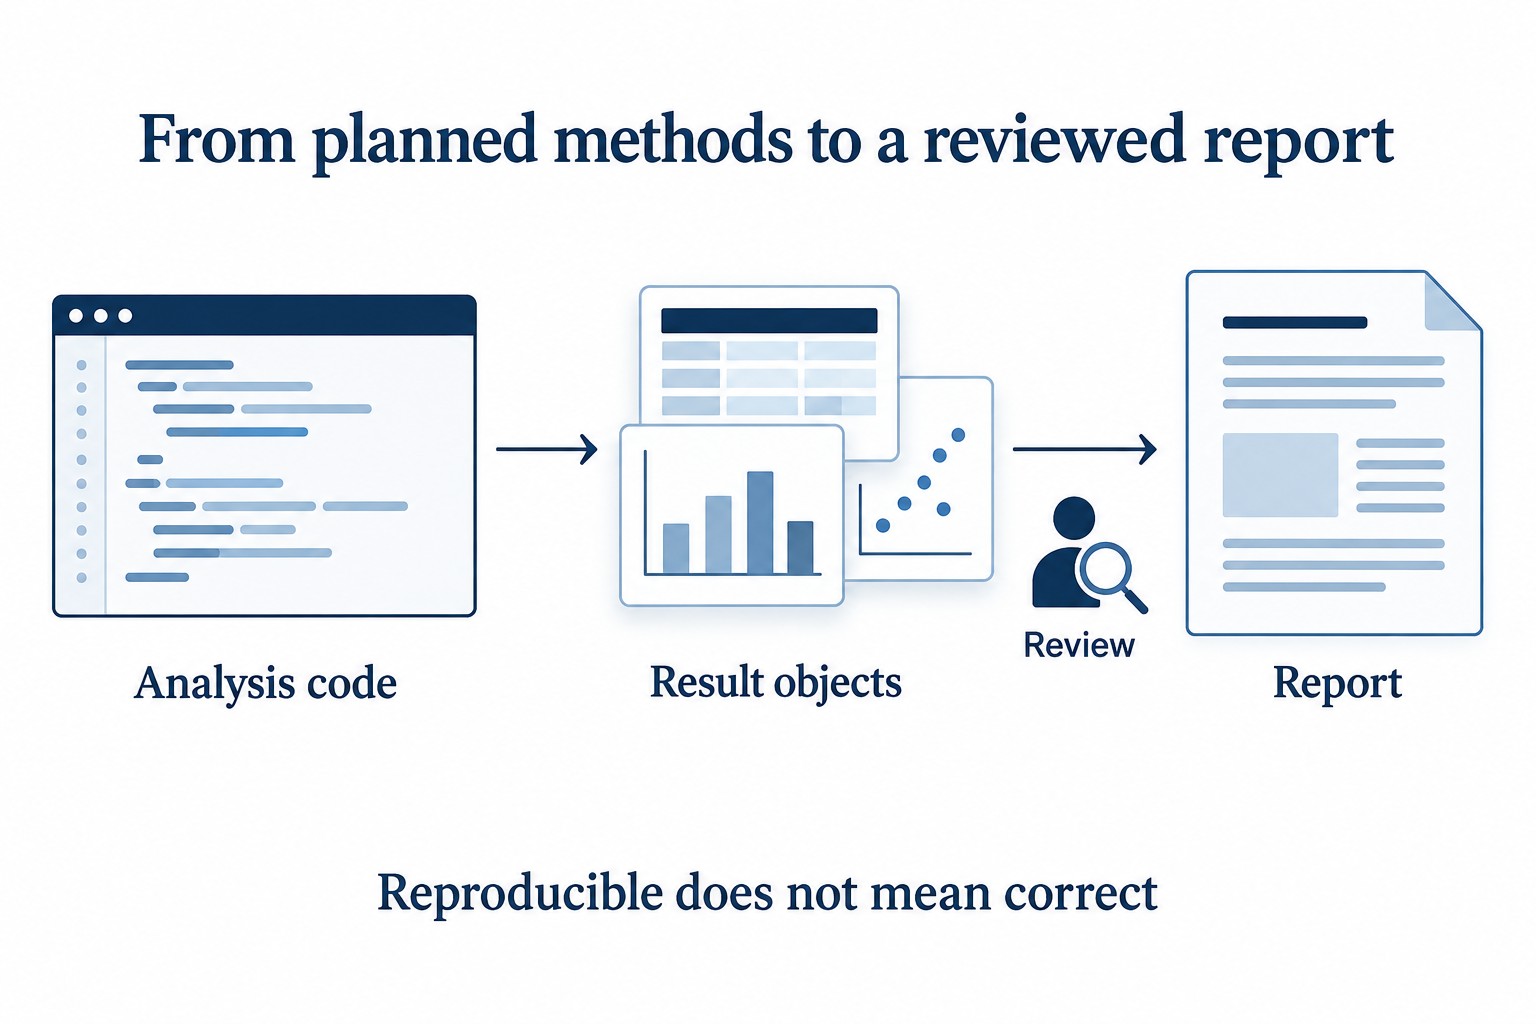
Researchers can reuse the same objects across different document formats. However, a reproducible report can still reproduce an incorrect calculation. Checks must confirm that the code follows the statistical methods described in the SAP.
The package does not select data analysis methods or approve analysis and interpretation. A statistician must decide how to analyze data and review interpretations. Maintain documented code versions, inputs and output checks during analysis. This supports preparation of a clinical study report, although the paper does not establish a regulatory reporting system.
How Data Access and Adaptive Designs Shape the Clinical Trial Statistical Analysis Plan
The availability of data affects when teams can perform valid statistical analyses. Delayed outcomes, incomplete follow-up and restricted access can change what an interim dataset represents. Therefore, a well-written SAP needs data cutoffs, access rules and procedures for missing data.
ICH E9, Statistical Principles for Clinical Trials, links prespecification with protection against bias [2]. Its principles remain relevant when digital systems accelerate data collection. Faster processing does not remove the need to define which information enters each analysis.
Adaptive designs make this distinction important. Teams must separate operational monitoring from access to comparative unblinded results. Furthermore, they need documented responsibilities, controlled amendments and reproducible code. More available information does not automatically justify more analytical freedom.
An AI-assisted consistency check could compare a study protocol with its SAP and flag conflicting endpoints or assessment times. This remains a potential application requiring evaluation, access controls and human review. The cited software papers do not establish that capability.
For a statistical analysis plan used in a clinical trial, best practice starts with clear ownership. Research organizations should independently test proposed tools against discrepancies and assess missed errors as well as false alarms. Good clinical practice requires accountable oversight throughout clinical research and medical research.
Discuss AI Integration for Your Healthcare Research Workflow
Contact Neural Board about a defined task, such as protocol-to-SAP consistency checks or connecting data preparation with reporting. Share your clinical study objectives, current systems and data-access constraints. We can discuss a suitable approach, its evaluation needs and where human review belongs, without promising automated approval or guaranteed clinical outcomes.
References
- Gamble, Carrol, et al. “Guidelines for the Content of Statistical Analysis Plans in Clinical Trials.” JAMA, 19 Dec. 2017, https://jamanetwork.com/journals/jama/fullarticle/2666509.
- International Conference on Harmonisation of Technical Requirements for Registration of Pharmaceuticals for Human Use. E9: Statistical Principles for Clinical Trials. U.S. Food and Drug Administration, Sept. 1998, https://www.fda.gov/media/71336/download.
- Grayling, Michael J., and James M. S. Wason. “A Web Application for the Design of Multi-Arm Clinical Trials.” BMC Cancer, 31 Jan. 2020, https://link.springer.com/article/10.1186/s12885-020-6525-0.
- Jaki, Thomas, et al. “The R Package MAMS for Designing Multi-Arm Multi-Stage Clinical Trials.” Journal of Statistical Software, vol. 88, no. 4, 2019, pp. 1-25, https://www.jstatsoft.org/article/view/v088i04.
- Kane, Michael, et al. “Automating Reproducible, Collaborative Clinical Trial Document Generation with the listdown Package.” The R Journal, vol. 13, no. 1, 2021, pp. 556-62, https://journal.r-project.org/articles/RJ-2021-051/.