
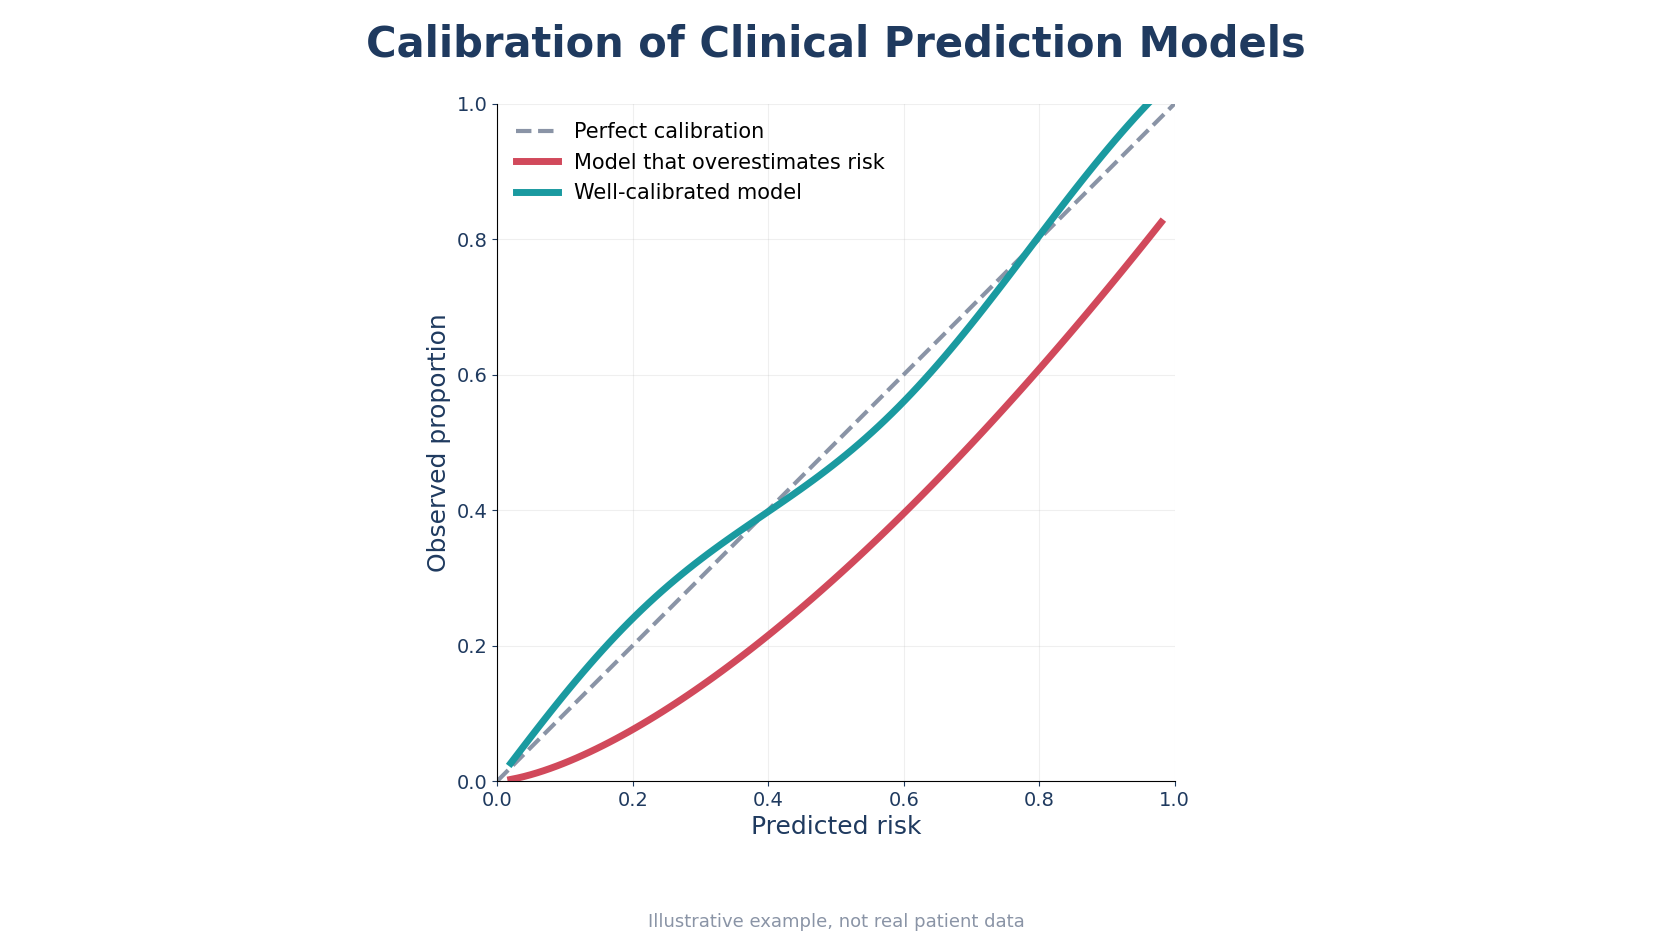
A clinical prediction model can rank patients correctly and still give them the wrong absolute risk. A model using outdated data may tell every patient their risk is 30% when the real rate is 10%. This article explains the calibration of clinical prediction models, and shows three studies that tested risk prediction in practice.
What Is Calibration in a Clinical Prediction Model, and How Does It Differ From Discrimination?
Most of these models estimate the probability of a binary outcome: the event happens or it does not. First, the two main aspects of predictive accuracy are discrimination and calibration [1]. Calibration measures the agreement between observed and predicted probabilities. For example, if a score assigns a 20% risk to 100 similar patients, about 20 of them should have the event. Discrimination, in contrast, answers a different question. It measures how well it separates patients who will have the event from those who will not. The most common discrimination metric is the c-statistic, or AUC. As a result, a multivariable prediction model can have good discrimination and poor calibration at the same time.
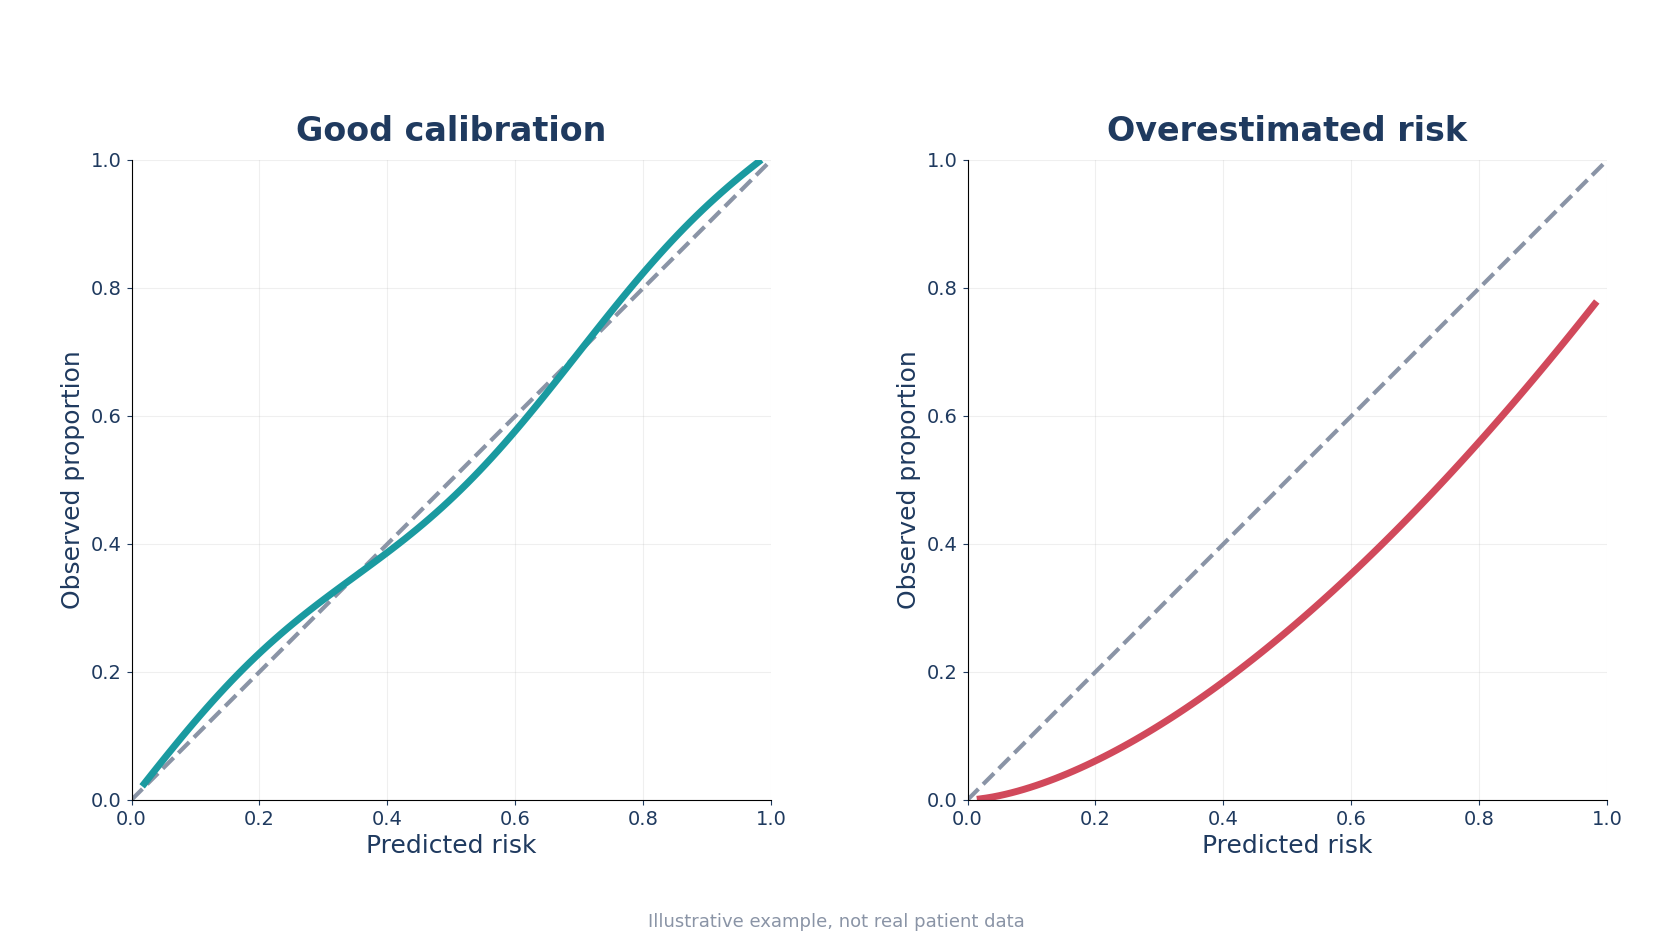
The calibration curve, also called a calibration plot, is the standard tool for calibration assessment. It plots the predicted probability on the x-axis and the observed proportion on the y-axis. A well-calibrated curve stays close to the 45-degree line. Some authors also add the risk distribution, stratified by outcome, which shows aspects of discrimination as well [1]. Van Calster et al. define four levels of calibration [2]:
- Mean calibration (calibration-in-the-large): the average predicted risk equals the overall event rate.
- Weak calibration: the intercept is 0 and the slope is 1. Predictions are neither systematically wrong nor too extreme.
- Moderate calibration: predicted probabilities match observed proportions across the whole range. A smooth curve such as a LOESS or spline fit then checks this.
- Strong calibration: predictions match outcomes for every possible combination of covariate values, a utopic goal.
Sample Size and the Calibration of Clinical Prediction Models
Stable predictions start at model development. Logistic regression overfits when the sample size is small relative to the number of predictors. This also holds whether the predictors are age, blood pressure, or biomarker values. Overfitting makes the apparent performance too optimistic and the predictions too extreme in new data [3]. The classic rule of thumb asks for at least 10 events per predictor. Riley et al. go beyond this rule for developing prediction models. They calculate a minimum sample size tailored to each setting [3]. The broader advice is to balance complexity with the available sample size [2].
Why the Calibration of Clinical Prediction Models Matters for Clinical Risk, Decisions and Patient Counseling
Miscalibration has direct costs. A score with good discrimination can still overstate or understate clinical risk for every patient. As a result, that shifts treatment decisions and changes what clinicians tell patients when they individualize treatment. When tools predict health problems before symptoms appear, small errors can move whole patient groups across a treatment threshold. Assessing calibration is therefore as important as checking discrimination. Van Calster et al. call calibration the Achilles heel of predictive analytics. Yet validation studies report it far less often than discrimination [2]. The three cases below show different ways models fail this check, and how researchers catch it.
Case 1. A Risk Score That Overestimated Risk in Almost Every Validation (Pooled Cohort Equations)
Cardiovascular prevention runs on risk scores. The Pooled Cohort Equations, introduced with the 2013 ACC/AHA cholesterol guideline, estimate 10-year cardiovascular risk and guide statin eligibility. Cook and Ridker reviewed the published external validation studies of these equations in US and European cohorts [4]. Moreover, most of these cohorts were more contemporary than the ones used to develop the guideline. In almost all of them, the equations overestimated the observed risk.
This matters because overestimation pushes some patients across the statin threshold even though their original risk is lower than predicted. Cook and Ridker discuss possible reasons for the discrepancies. One is the difference between the derivation cohorts and more current populations. Their proposed fix, then, is recalibration: adjust the equations so that predicted and observed risks match for current clinical practice. So the lesson for clinicians is clear. Even a widely adopted prognostic tool needs independent evaluation. Thus, recalibration to local data can restore clinical utility without rebuilding it.
Case 2. Calibration Drift Over Nine Years in Acute Kidney Injury Models
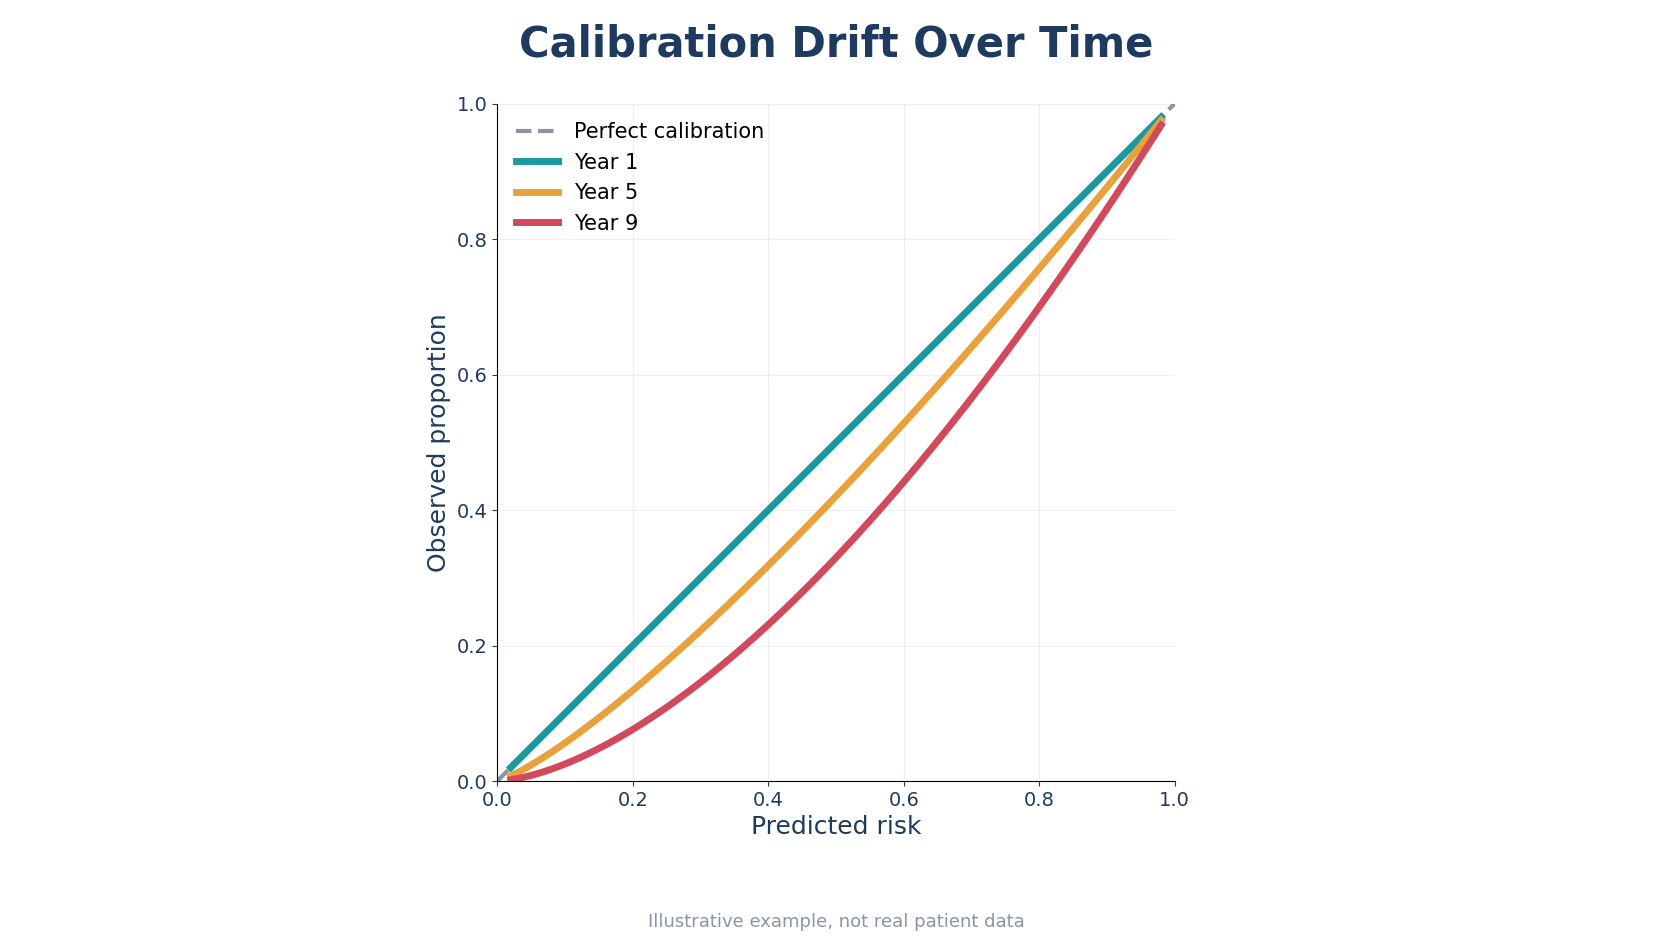
Performance can also decay after deployment. Davis and colleagues built 7 models for hospital-acquired acute kidney injury on 2003 admissions to Veterans Affairs hospitals [5]. They used regression and machine learning methods, and then validated each one over the following 9 years. Discrimination held up for all 7. Calibration, however, did not: every model increasingly overpredicted risk as the years passed.
The drift differed by method. While overprediction grew steadily for regression approaches, random forest and neural network approaches kept it small and stable. They also captured more admissions across the range of predicted probabilities. Overall, the authors linked this performance drift to changes in the underlying AKI rate. They also tied the diverging patterns across methods to shifts in the associations between inputs and the outcome. Their conclusion is practical: updating protocols should respond to periods of rapid drift. Fixed annual or biannual reviews are not enough. In routine clinical use, calibration is a moving target that needs active monitoring.
Case 3. How to Draw and Read Calibration Curves With Loess Smoothers (Austin and Steyerberg)
The third case is methodological: how to draw and read calibration curves for clinical prediction models. Austin and Steyerberg used Monte Carlo simulations with simulated data. They tested whether loess-smoothed calibration curves can detect a misspecified or overfit logistic regression model [1]. The smoothed curves revealed moderate departures from linearity. They also showed when the fit left out an interaction between a binary covariate and a continuous variable.
In external validation samples, the curves flagged cases that overfit the development data. Patterns were also clearer with larger samples, higher event rates, and higher discrimination. The default smoother span in R (0.75) performed well, and you can add confidence intervals around the curve. The practical recipe for evaluating prediction models is simple. Plot observed against predicted risk with a flexible smoother, then read the distance from the diagonal. However, treat small samples with caution, because noise can hide real miscalibration.
The Future of Calibration: Data Availability, Model Development and Continuous Updating
Three directions follow from these cases. First, the calibration of clinical prediction models belongs in every protocol for development and validation of risk prediction models. The TRIPOD reporting guideline requires it, alongside discrimination measures. Second, teams should calibrate a score locally before use at a new site. They should also update it when data shift, as Case 2 showed [5]. Updating a regression-based score can start with a simple intercept correction. However, full refitting pays off when the validation sample is large enough [2]. The same principles extend from binary outcomes to survival analysis with Cox proportional hazards models [3].
Third, machine learning tools need the same checks as regression tools, because flexibility alone does not protect against miscalibration. Decision curve analysis adds the clinical view. It shows the net benefit across risk cut-offs, so teams can judge whether a score is clinically useful. Progress also depends on data availability. Independent teams can run external validation only when they can access suitable data. Careful development data matter just as much, because problems such as data leakage in healthcare quietly destroy that agreement. The implications for model development are simple. Complex models trained on small samples will keep failing this check in new settings [3].
Contact Us for Help With Model Validation
We help healthcare organizations evaluate their algorithms before and after deployment. Our review covers the calibration of clinical prediction models, the validation design and the study size. Setting up monitoring for drift is part of that work. Contact us to discuss your model validation needs.
References
- Austin, Peter C., and Ewout W. Steyerberg. “Graphical Assessment of Internal and External Calibration of Logistic Regression Models by Using Loess Smoothers.” Statistics in Medicine, vol. 33, no. 3, 2014, pp. 517-535. https://doi.org/10.1002/sim.5941.
- Van Calster, Ben, David J. McLernon, Maarten van Smeden, Laure Wynants, and Ewout W. Steyerberg. “Calibration: The Achilles Heel of Predictive Analytics.” BMC Medicine, vol. 17, 2019, article 230. https://doi.org/10.1186/s12916-019-1466-7.
- Riley, Richard D., et al. “Calculating the Sample Size Required for Developing a Clinical Prediction Model.” BMJ, vol. 368, 2020, m441. https://doi.org/10.1136/bmj.m441.
- Cook, Nancy R., and Paul M. Ridker. “Calibration of the Pooled Cohort Equations for Atherosclerotic Cardiovascular Disease: An Update.” Annals of Internal Medicine, vol. 165, no. 11, 2016, pp. 786-794. https://doi.org/10.7326/M16-1739.
- Davis, Sharon E., et al. “Calibration Drift in Regression and Machine Learning Models for Acute Kidney Injury.” Journal of the American Medical Informatics Association, vol. 24, no. 6, 2017, pp. 1052-1061. https://doi.org/10.1093/jamia/ocx030.